MAIUS:9.21xrealROASinonemonth
One month of full-funnel Meta ads management. ROAS was measured not by the ad panel's pixel estimate but by the e-commerce store's real order revenue.
Screenshots from the ad dashboard
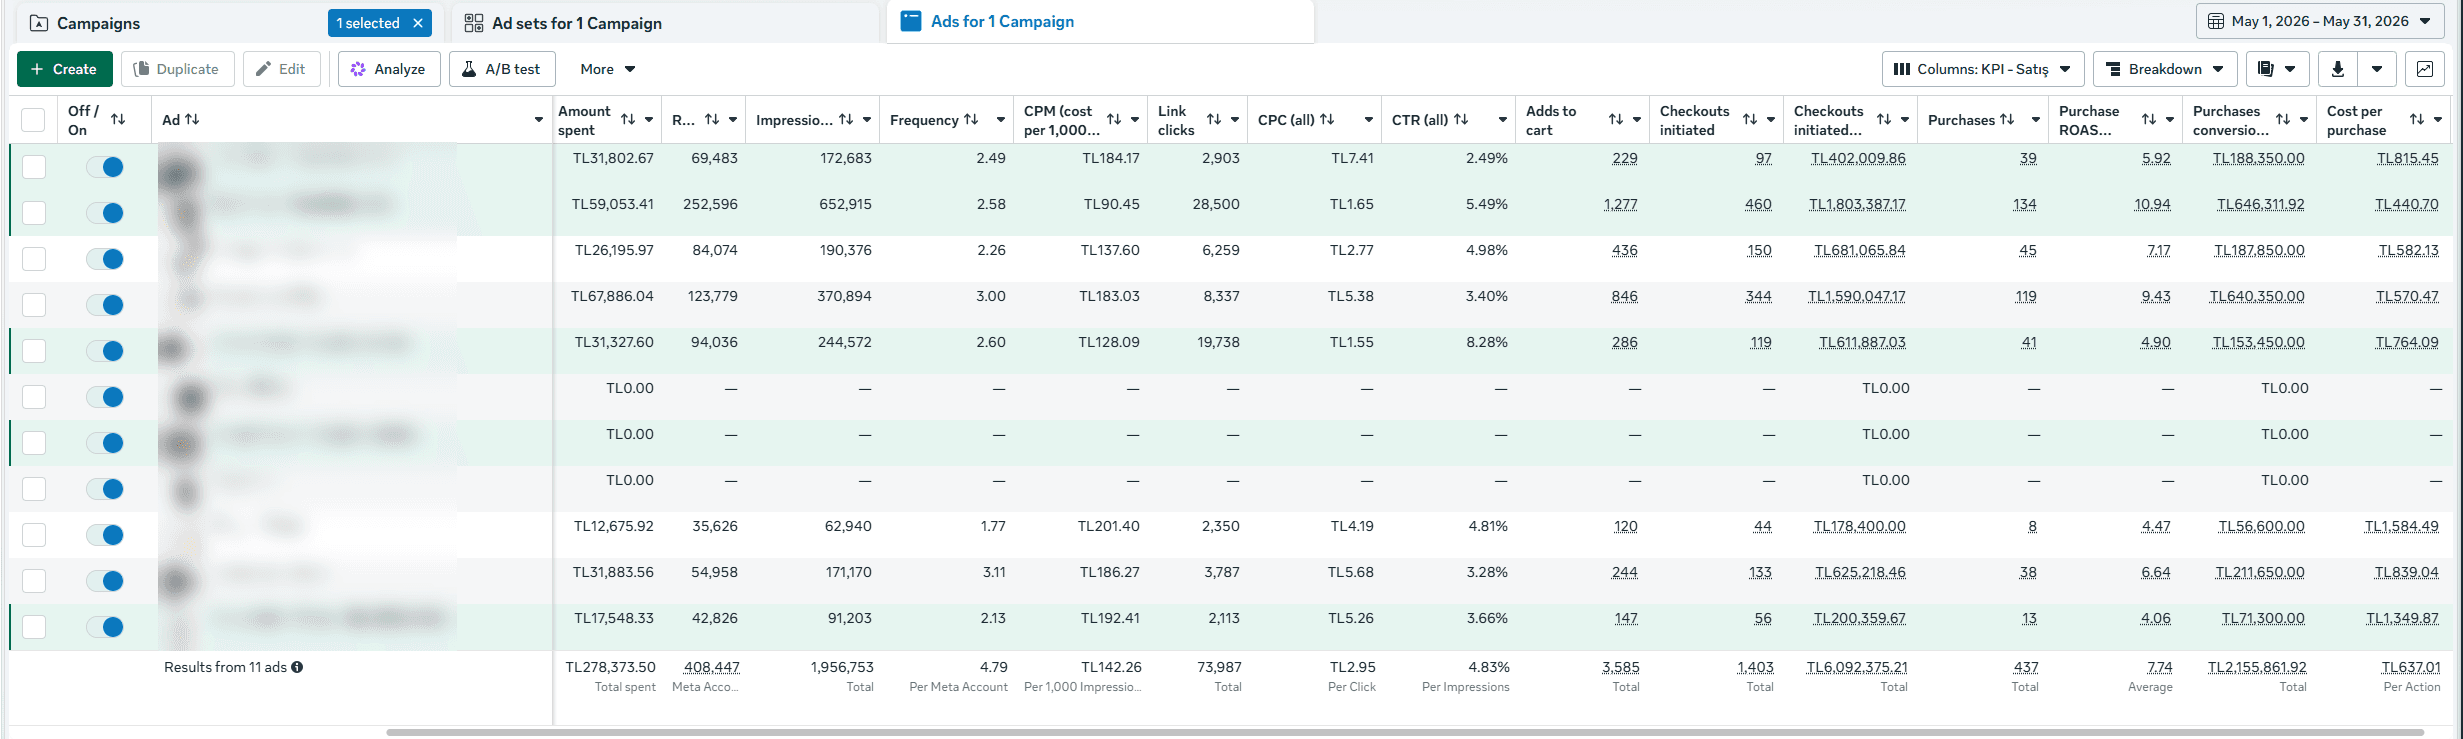
The screenshots below are real Meta Ads Manager views from May 2026. Campaign names are blurred for confidentiality; spend, ROAS and conversion data are untouched.


About the brand
A women's fashion brand selling across Türkiye through its own e-commerce store. It offers a wide range across suits, dresses, jackets and sportswear. Meta ads have been the brand's main sales channel for months.
The account is at a mature stage: prospecting, retargeting, retention and scale campaigns run simultaneously as a full funnel. This case shows one month (May 2026) of end-to-end performance.
Why they chose us
The real difference is on the measurement side: we calculate ROAS not from the ad panel's pixel estimate but directly from the e-commerce store's real order revenue. The reported number is not attribution inflation — it is actual revenue in the till.
- Sustain profitable scale through the whole month with a full-funnel structure
- Measure ROAS with real e-commerce revenue, avoiding inflated pixel numbers
- Grow revenue while keeping cost per order within a sustainable band
The challenges we faced
On a mature account the challenge isn't 'building from scratch' — it's 'measuring correctly while protecting profitable scale'. This month's main threads:
Pixel ROAS Inflates Reality
The pixel ROAS reported by Meta's panel can overstate real revenue due to attribution windows and last-click modelling. Making the right calls required reconciling ad spend directly against the store's real order revenue.
Keeping the Full Funnel Balanced
With prospecting, retargeting, retention and scale running at once, distributing budget correctly across layers is critical. Overloading one layer hurts blended ROAS; each layer's role had to be protected separately.
CPA Control at Scale
The most common risk while growing revenue is cost per order slipping out of control. Daily CPA tracking and pausing weak ad sets in time were essential to keep spend in efficient channels.
Creative Fatigue
On a mature account the same creatives wear out fast: CTR drops, CPM climbs. Without a framework testing a fresh creative stream every week, performance kept eroding.
4-phase structure
We ran the month on a full-funnel architecture with all four layers working together. On the measurement side, everything was tied to real revenue.
Prospecting: New Customers
Broad and interest-based audiences reached new buyers; the main share of the monthly budget went here. A women 18-65 core audience ran in parallel with algorithm-open broad targeting.
Retargeting: Re-engagement (DPA)
Users who browsed the site, added to cart or engaged on Instagram were recaptured with dynamic product ads (DPA). This layer alone delivered a 6%+ click-through rate on ~€371 of spend.
Retention: Existing Customers
Audiences who purchased in the last 180 days and all-time were shown new products and campaigns. The highest ROAS came from this layer; repeat sales were generated at low cost.
Scale + Real-Revenue Measurement
Budget shifted to the products and creatives with the best ROAS. At month's end, Meta spend was reconciled end-to-end against the store's order revenue to compute the real ROAS — not the pixel, the revenue in the till.
What we achieved together
In May, €7,420 of ad spend turned into €68,400 of e-commerce revenue. Real-revenue ROAS was 9.21x: roughly €9 back for every €1 spent. 708 orders at a €97 average basket.
Real ROAS
9.21x
revenue ÷ spend
E-commerce Revenue
€68K
May 2026
Orders
708
AOV €97
Click-Through Rate
5.10%
Cost per Order
€10
Ad Spend
€7.41K
31 days
Ad Side (Meta Ads)
- Spend: €7,420
- Impressions: 2,628,640
- Clicks: 133,939
- Click-through rate (CTR): 5.10%
- Cost per click (CPC): €0.056
Sales Side (E-commerce)
- Revenue: €68,400
- Orders: 708
- Average basket (AOV): €97
- Ad cost per order: €10
- Real-revenue ROAS: 9.21x
Lessons Learned
- Measuring with real revenue beats the pixel: decisions are made without attribution inflation
- A full funnel (prospecting + retargeting + retention) lifts blended ROAS above any single layer
- Shifting budget to winners lowers unit cost at scale
- Reconciling ad spend against store revenue every month removes the guesswork